Which states were the most racist on Twitter after President Barack Obama was reelected on Nov. 6?
Thanks to a new study published by Floating Sheep— a site run by geography professors and graduate students “dedicated to mapping and analyzing user generated geocoded data—we can now know for certain.
The collective looked at the number of tweets that specifically contained the word “monkey” or “ni**er” as well as the keyword “Obama,” “reelected,” or “won” and then divided them by the number of total tweets across the country. Each state was also assigned a location quotient (LQ) that was based on the percentage of racist tweets that corresponds to them, divided by the percentage of total tweets made in that area relative to the rest of the country.
From the study:
“A score of 1.0 indicates that a state has relatively the same number of hate speech tweets as its total number of tweets. Scores above 1.0 indicate that hate speech is more prevalent than all tweets, suggesting that the state’s ‘twitterspace’ contains more racists[sic] post-election tweets than the norm.”
So, which states had the highest ratio of racist tweets?
Alabama and Mississippi—by a very large margin. The states scored 8.1 and 7.4, respectively. To put that into context, the third state with the most racist tweets was Georgia, which had a 3.6 LQ score.
The most tolerant state in the study was Rhode Island, which had no racist tweets in the 395 geocoded “hate tweets” sampled. Arizona, New York, and Indiana also had a low LQ scores.
Alaska, Idaho, South Dakota, Wyoming, Montana, and Hawaii were not given an LQ because no racist tweets that came from those states showed up in the sample, and those states had a very small amount of tweets originating from there in the first place.
Floating Sheep also posted a map, which you can see below. The yellow states represent those that have a low LQ (less than 1.2) and the green ones have a higher LQ. The darker the color, the more racist the state.
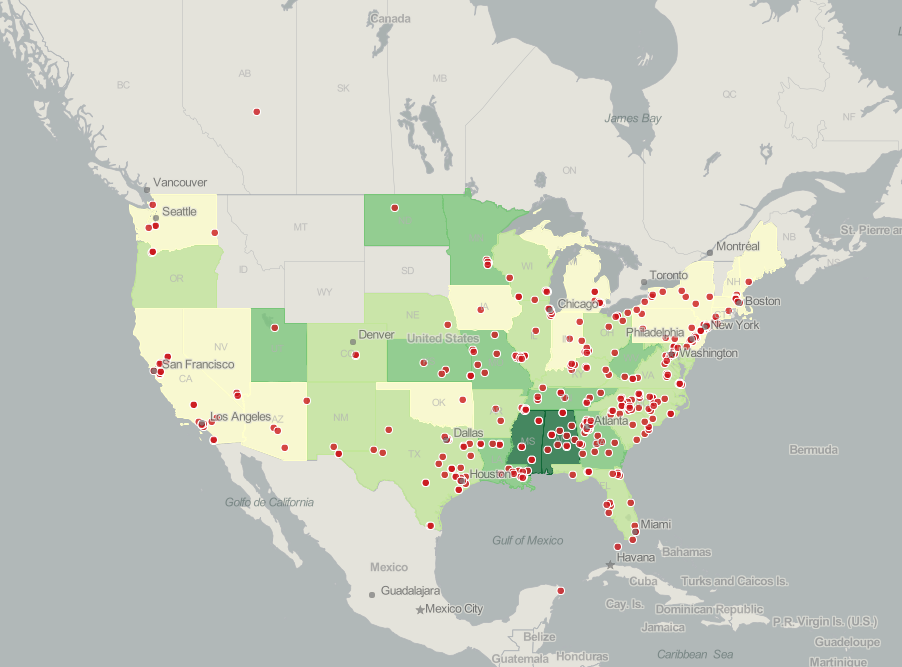
Photo via Geocommons
In fairness to the green states, this study doesn’t mean that racism expressed via social media doesn’t exist or isn’t prevalent in the yellow states. Earlier this week, a woman was fired from her job in California, a state with an LQ of 0.5, because of a Facebook status where she wrote “And another 4 years of the nig**er, maybe he will get assassinated this term..!!”
Photo via PureLolz468/YouTube

