
Some tweets are like tornados, devastating the landscape. But most are like breezes, quickly forgotten.
A new tool from Twitter and Vizify helps tweeters reflect on their last year in the community, visualizing exactly what they’ve been talking about over the last 12 months. The Year on Twitter tool was released as Twitter revealed some of the hottest tweets, topics, trends, new users, and stories of the year.
After linking your Twitter account and providing an email address, Year on Twitter gives a neat overview of what you’ve tweeted about over the last 12 months. If you’ve tweeted more than 3,200 times this year, Vizify will only look at those tweets (apps using Twitter’s API can only access the last 3,200 tweets from your timeline).
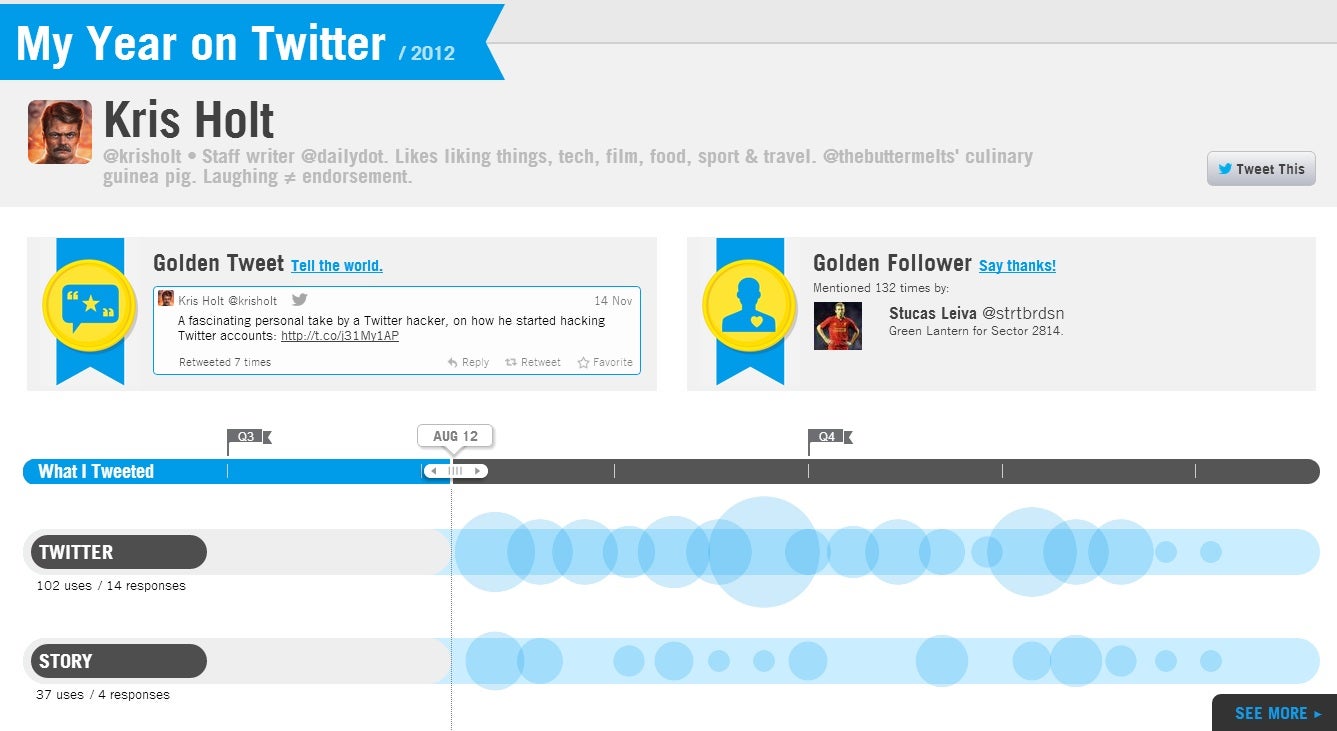
The result is something rather cool. Your personal page highlights your “Golden Tweet” (your one with the most retweets), your follower who’s replied to your tweets most often, and a chart of your most talked-about topics.
My results only go as far back as August, since I’ve tweeted 3,200 times since then. My most popular topics were “Twitter” and “story” (which, uh, don’t have anything to do with my job, of course).
In December, a month of reflection, looking back to see what we tweeted about—when many of our tweets have a very short lifespan—helps give a little more permanence to Twitter’s real-time, ever-changing nature.
To look back at more from Twitter’s last year, check out the lovely minisite it’s set up.
Photo by photojenni/Flickr