When it comes to big-picture subjects like climate change or urban development, visuals get an idea across better than words. To wit: Google Earth recently released a new update to its remarkable Timelapse feature that aims to tell the story of how the world changes.
Timelapse has added four more years of data to its results, stretching back 32 years to 1984. Also, this update brings with it petabytes of high-resolution images from two satellites previously unavailable to users.
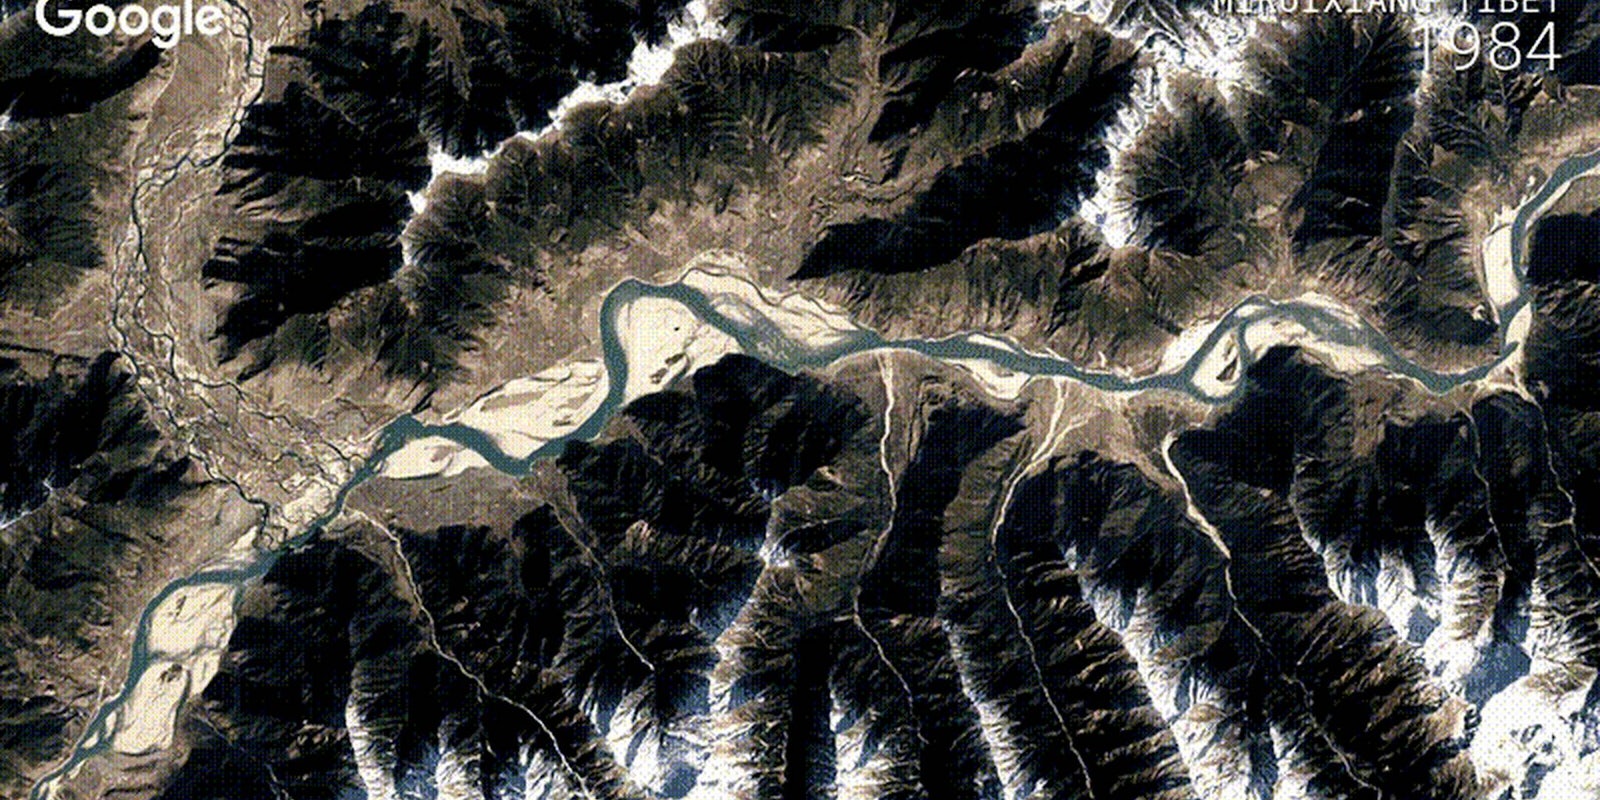
What that means for you as a Timelapse explorer is the ability to watch the Earth shift and develop along with the world over the course of the last three decades. Watch glaciers slice off the face of the planet, forests wiped out by wildfires, and sea levels rise. Look at drought-ravaged areas of America, and see how they’ve changed.
In some cases, like the development of the San Francisco-Oakland Bay Bridge, these graphics show the remarkable growth of cities in the last 30 years.
Others, like the Alberta Tar Sands, show what decades of industrial development can do to formerly lush lands.
No matter how you choose to use Google Earth Timelapse, the important thing is you’re looking at the history of the Earth and how it grows and dies with us. With written facts being more open to interpretation by our society more every day, it’s key to have a photographic record of how things used to be and how they’ve changed. You can’t argue with photographic records, at least for now.
Head over to Google Earth to get started.
