
Amsterdam is combining new forms of media with centuries of data to preserve the fascinating history of the city. The city’s digital map archive is a database of visualizations that guide you through the streets of Amsterdam during its most important years. Highlighting the database are interactive maps, Game of Thrones-like historical videos, and before-and-after photos of historic landmarks.
Here are some of the important and informative works created by the city of Amsterdam.
Building Amsterdam – Game of Thrones-style
These videos, created by the City Archive, show how Amsterdam developed throughout the decades. You can see how new canals were built in the 17th century, or when some of the most recognizable landmarks were erected during the second Golden Age. All of this is presented in a way that reminds us of the epic Game of Thrones intro.
135 years of archived photos
This project combines nearly 150 years of archived photos with a data visualization map so you can transport yourself anywhere in Amsterdam, at any time. The colors of the circles show the number of photos for that particular location, which is also given as a numerical value on each point. The more you zoom into the map, the more specific the location each of those spots gets.
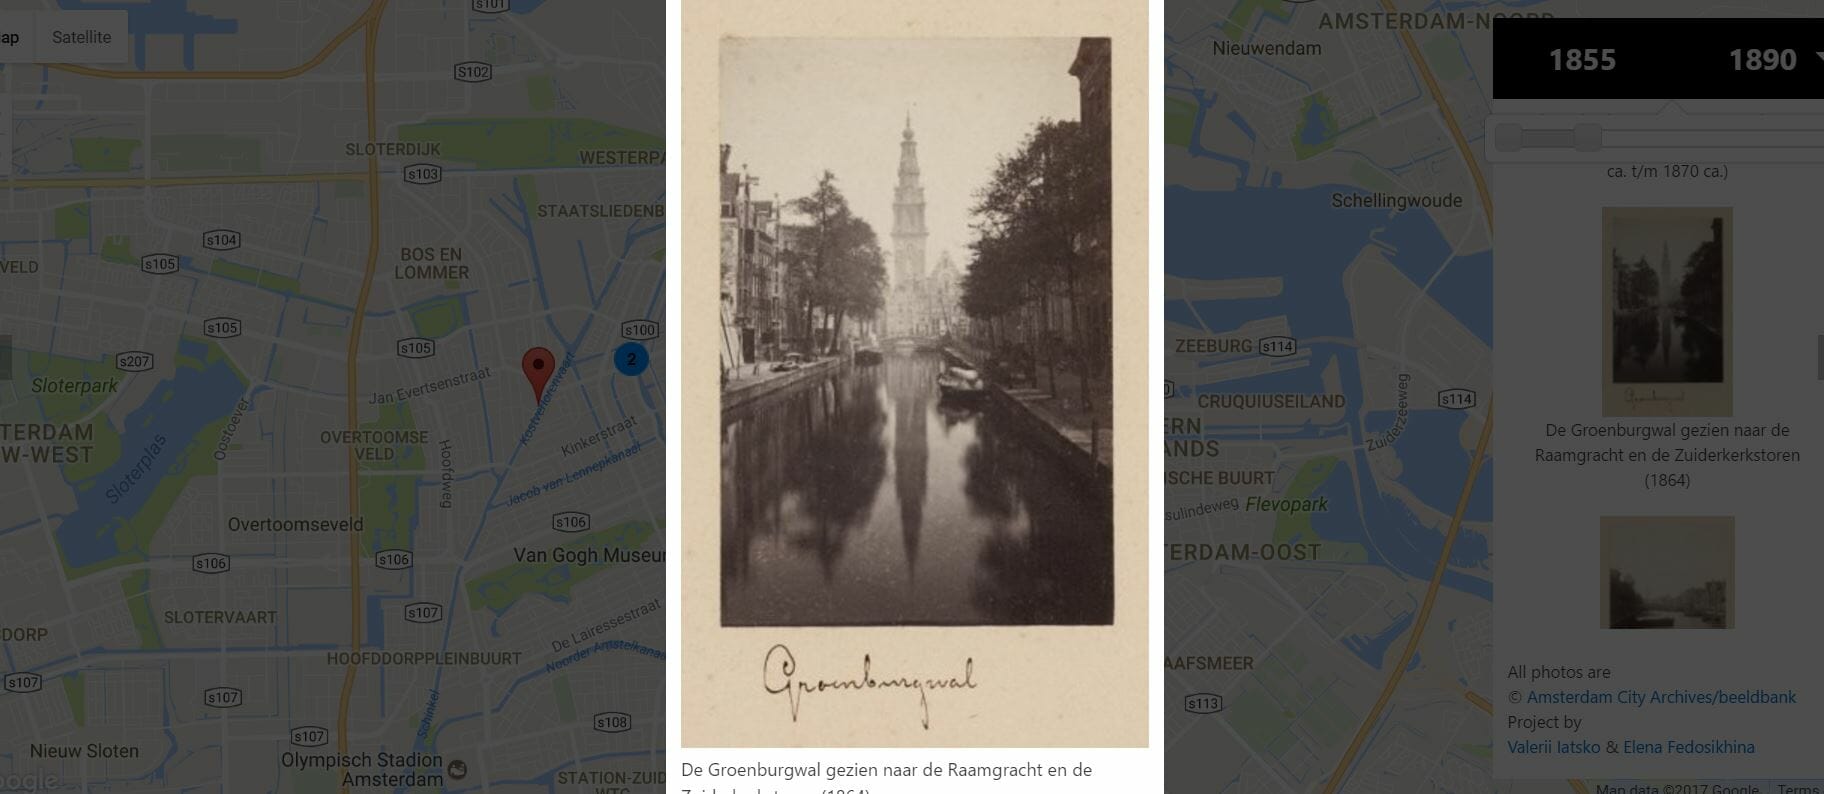
Just press on any circle on the map and you will see photos taken from 1855 to 1990 from that location. It’s fascinating to see how buildings age as you scroll through time.
The damage of WWII
Another visualization shows every spot in the city affected by the Second World War. Each point on the map represents a different method used during World War II that damaged the city. For example, the green icon represents bombs and grenades, while blue represents air raids.
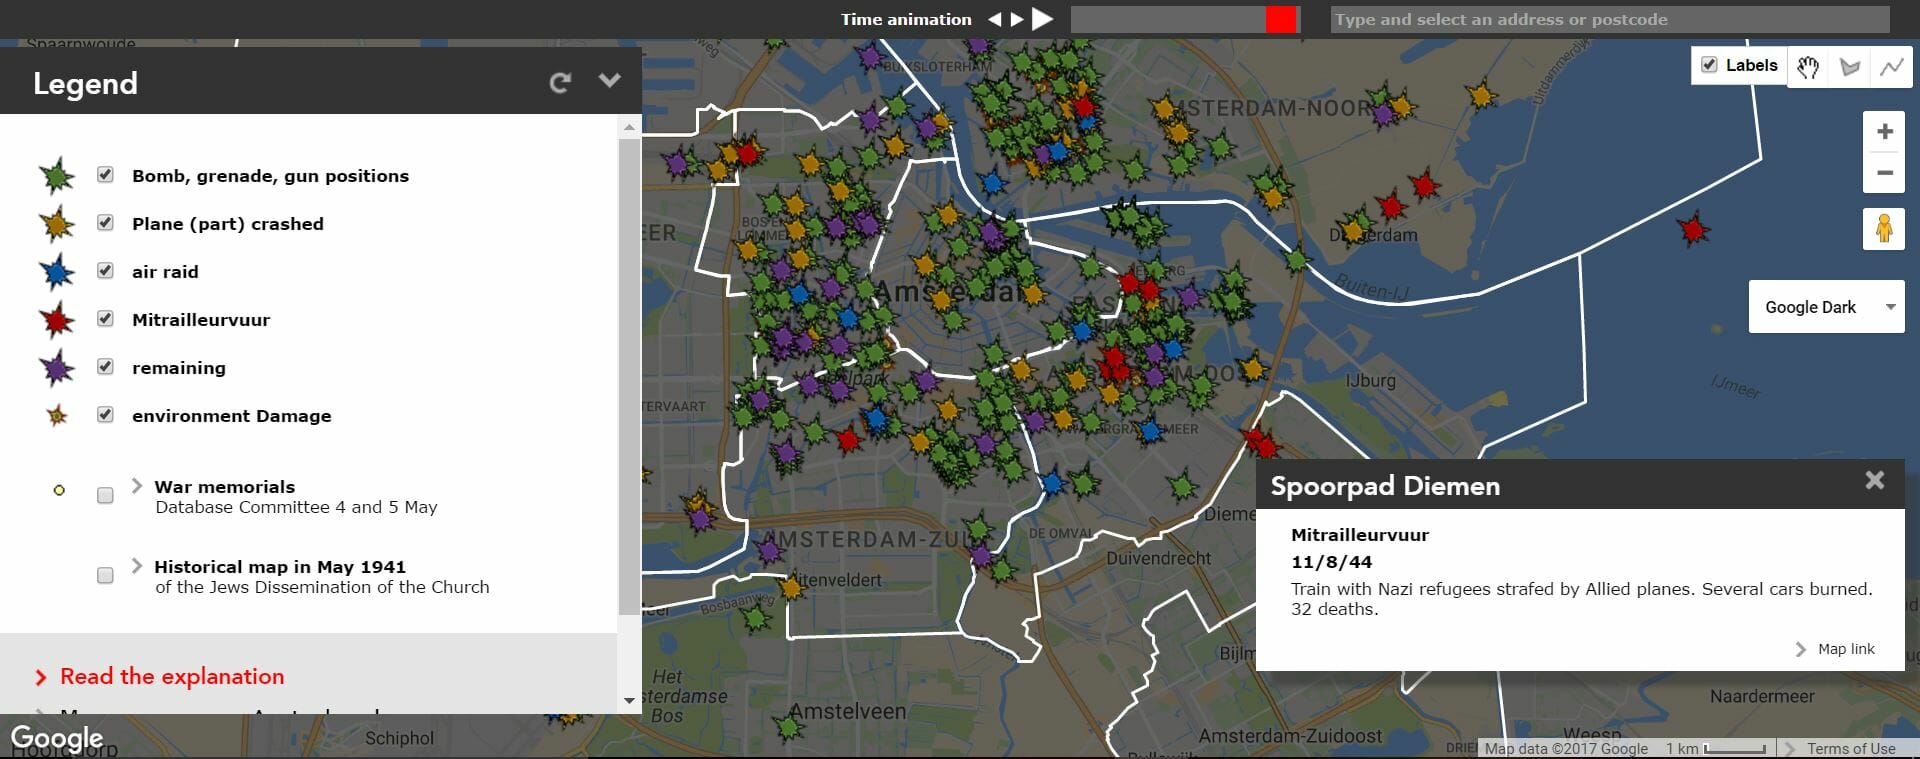
You will get more information about each of the incidents by pressing on any of the icons. Everything is in Dutch, so you’ll probably need to use a translator, but once you’ve done that, you’ll get an idea of what happened during this awful period in history.
Amsterdam growing over time
This simple map shows how the city spread over time. You can filter different time periods and see how each period influenced the growth of the city.
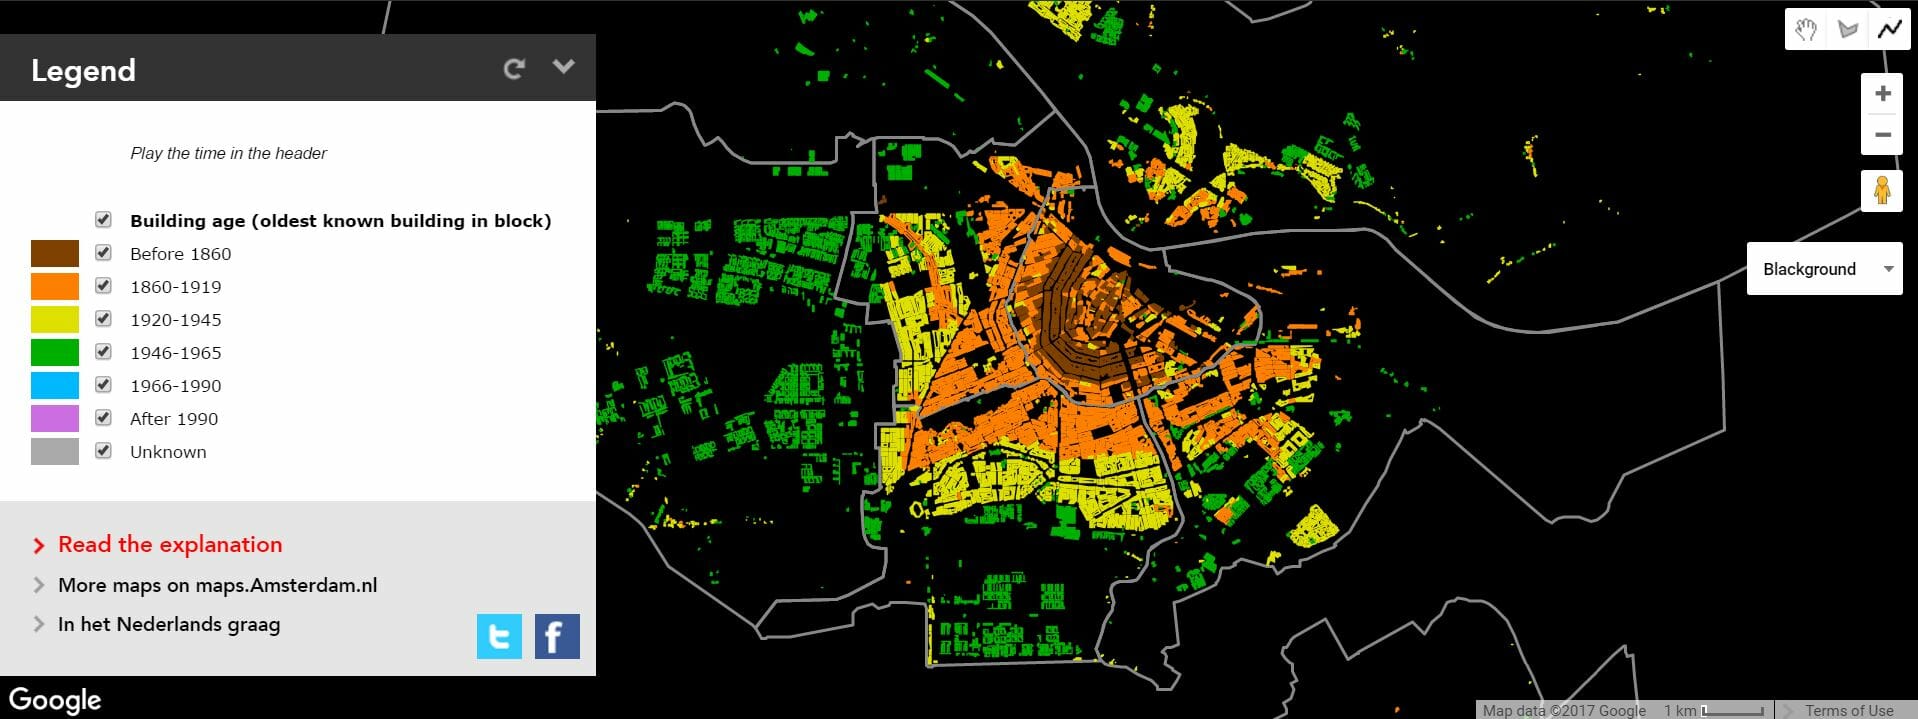
Note: We had to unselect and reselect time periods before their respective colors showed up on the map.
These examples are just a few of the projects the city is working on to preserve its history. You can view more on the city’s website, where you will find dozens of other visualizations that show everything from the density of honeybee populations to the soil quality of different regions.
H/T CityLab
