Thanks to a pair of researchers, you can now search all kinds of data about political ad buys on Facebook. The tool at ad.watch provides a fascinating glimpse into the big business of political ads on the world’s largest social media network.
Created by Manuel Beltrán and Nayantara Ranganathan, with support from Stadtkuratorin Hamburg, ad.watch is searchable by geographical area, content, date, candidate, and keyword. It reveals how much candidates are spending, when, where and on what. You can also search by keyword; a search for “healthcare” on August 7 revealed that since 2017, ads featuring the term have targeted California and New York more than other states.
By narrowing it down by politician and/or political organization, you can see who bought healthcare ads, what each ad said, when, where, for how much it was purchased and what reach it earned. The tool is clearly intended to serve the greater good.
“We believe that the closed nature of information about political advertising robs us of the power of political participation,” the site states.
“We are concerned that platforms architect the exploitation of personal data for political advertising, in the process heaping power with the advertisers and profit unto themselves, leaving behind a broken ground for a collective experience of politics, as well as for action.”
In the wake of the Cambridge Analytica scandal and revelations about Russia buying ads to influence American elections and sow racial discord, Facebook has been under intense pressure to make data about ad buys on the site more accessible and transparent. To date, it’s scoring a solid D- in this department.
In response to Facebook’s opaqueness, ProPublica, Mozilla, and Who Targets Me each created tools that allowed users to see how advertisers target them. Unlike ad.watch, which provides raw numbers that show how many people are reached by a political advertiser, these tools allowed people to see who was targeted by categories such as race, ethnicity, religion and political affiliation. Earlier this year, ProPublica reported, “the company inserted code in its website that blocks them.”
Months prior, the company had urged ProPublica to shut down its tool, and ads product management director Rob Leathern reportedly said it would “transition” the publication away from the tool by “enforcing on the existing terms of service that we have.”
At the time that the tools stopped working, a Facebook spokesperson told ProPublica that the change was “a routine update and applied to ad blocking and ad scraping plugins, which can expose people’s information to bad actors in ways they did not expect.”
Earlier this year, Facebook finally released a political ad transparency tool. But the Ad Library API was buggy and inadequate, and failed to meet Mozilla’s recommended guidelines signed by more than 70 experts.
Enter ad.watch. To create it, Beltran and Ranganathan manually pulled data from Facebook’s API.
To put their tool to the test, the Daily Dot sought to find out how much money Democratic presidential candidates are spending, how many ads they’re buying, and what kind of reach they’re seeing.
Candidates are listed sequentially from most to least spent; the time frame is from January 1 to August 1, 2019. Take note that some amounts are rounded, and several presidential candidates’ data, such as Sen. Cory Booker (D-N.J.), was not available.
Sen. Kamala Harris (D-Calif.)
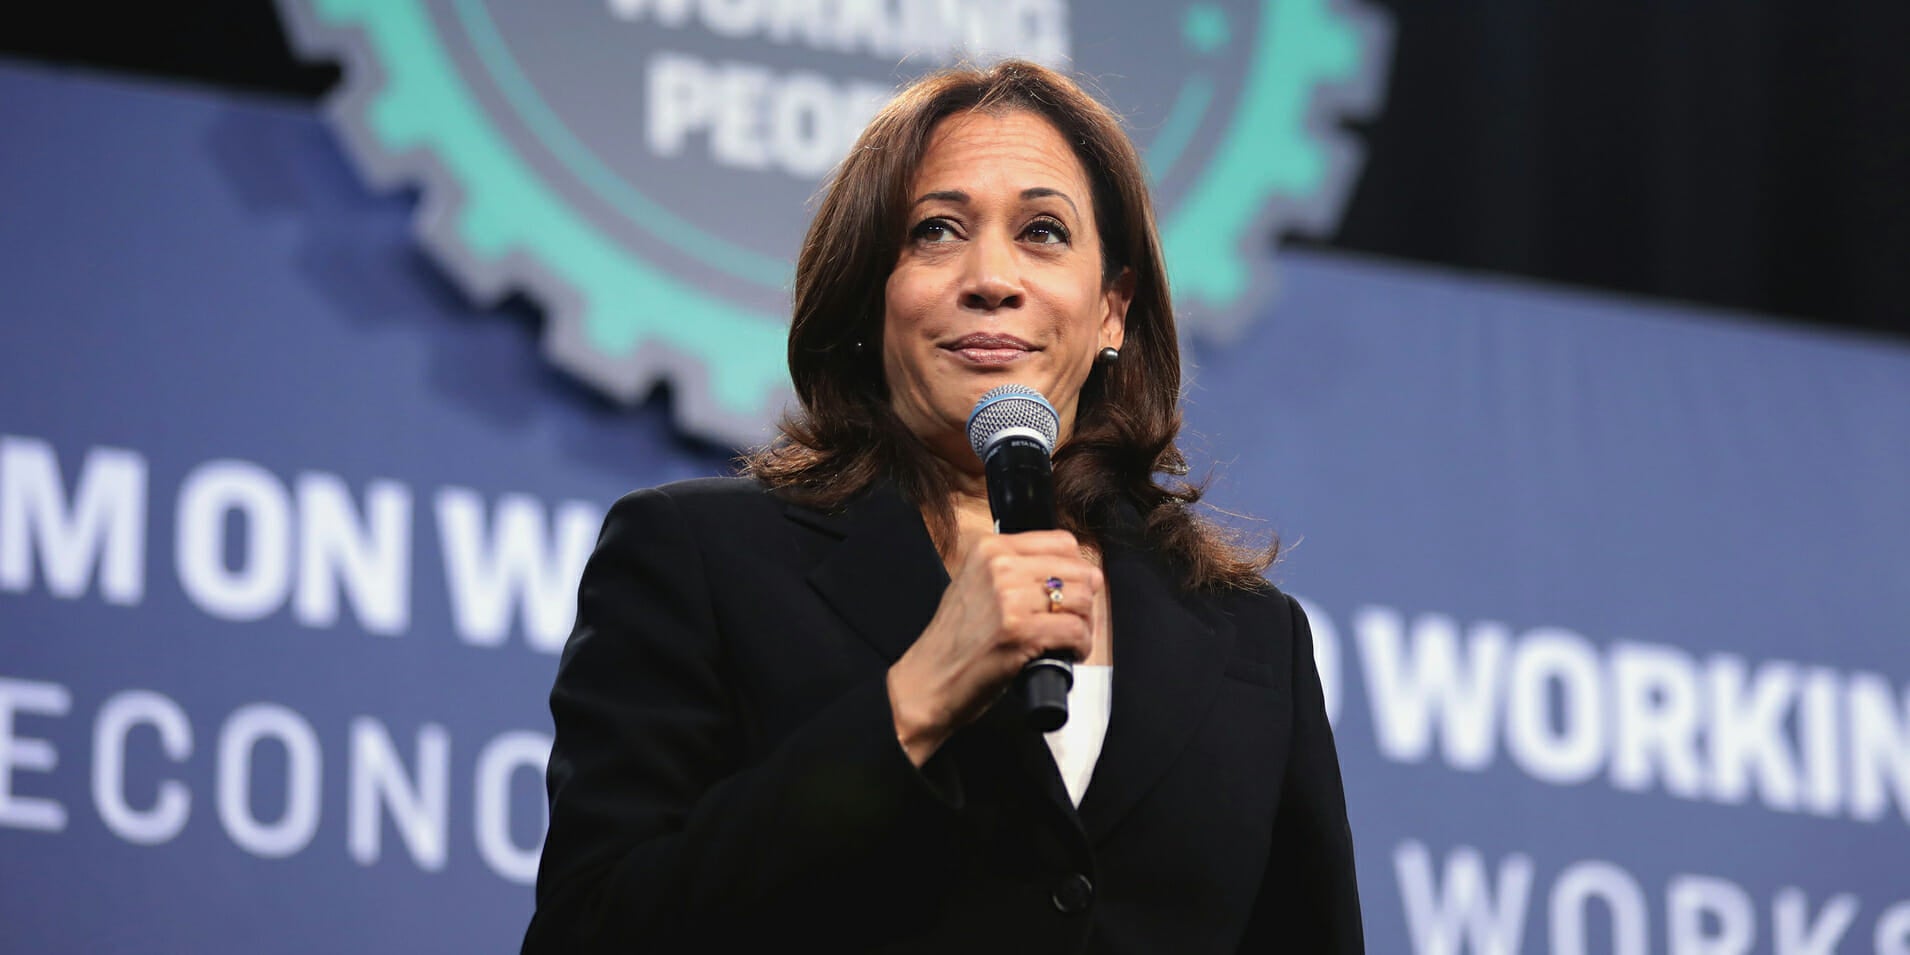
Total spent: $5.7 million
Number of ads: 85,152
Impressions: 96.6 million
Avg. spend per ad: $67
Cost per impression: $.06
Sen. Bernie Sanders (I-Vt.)
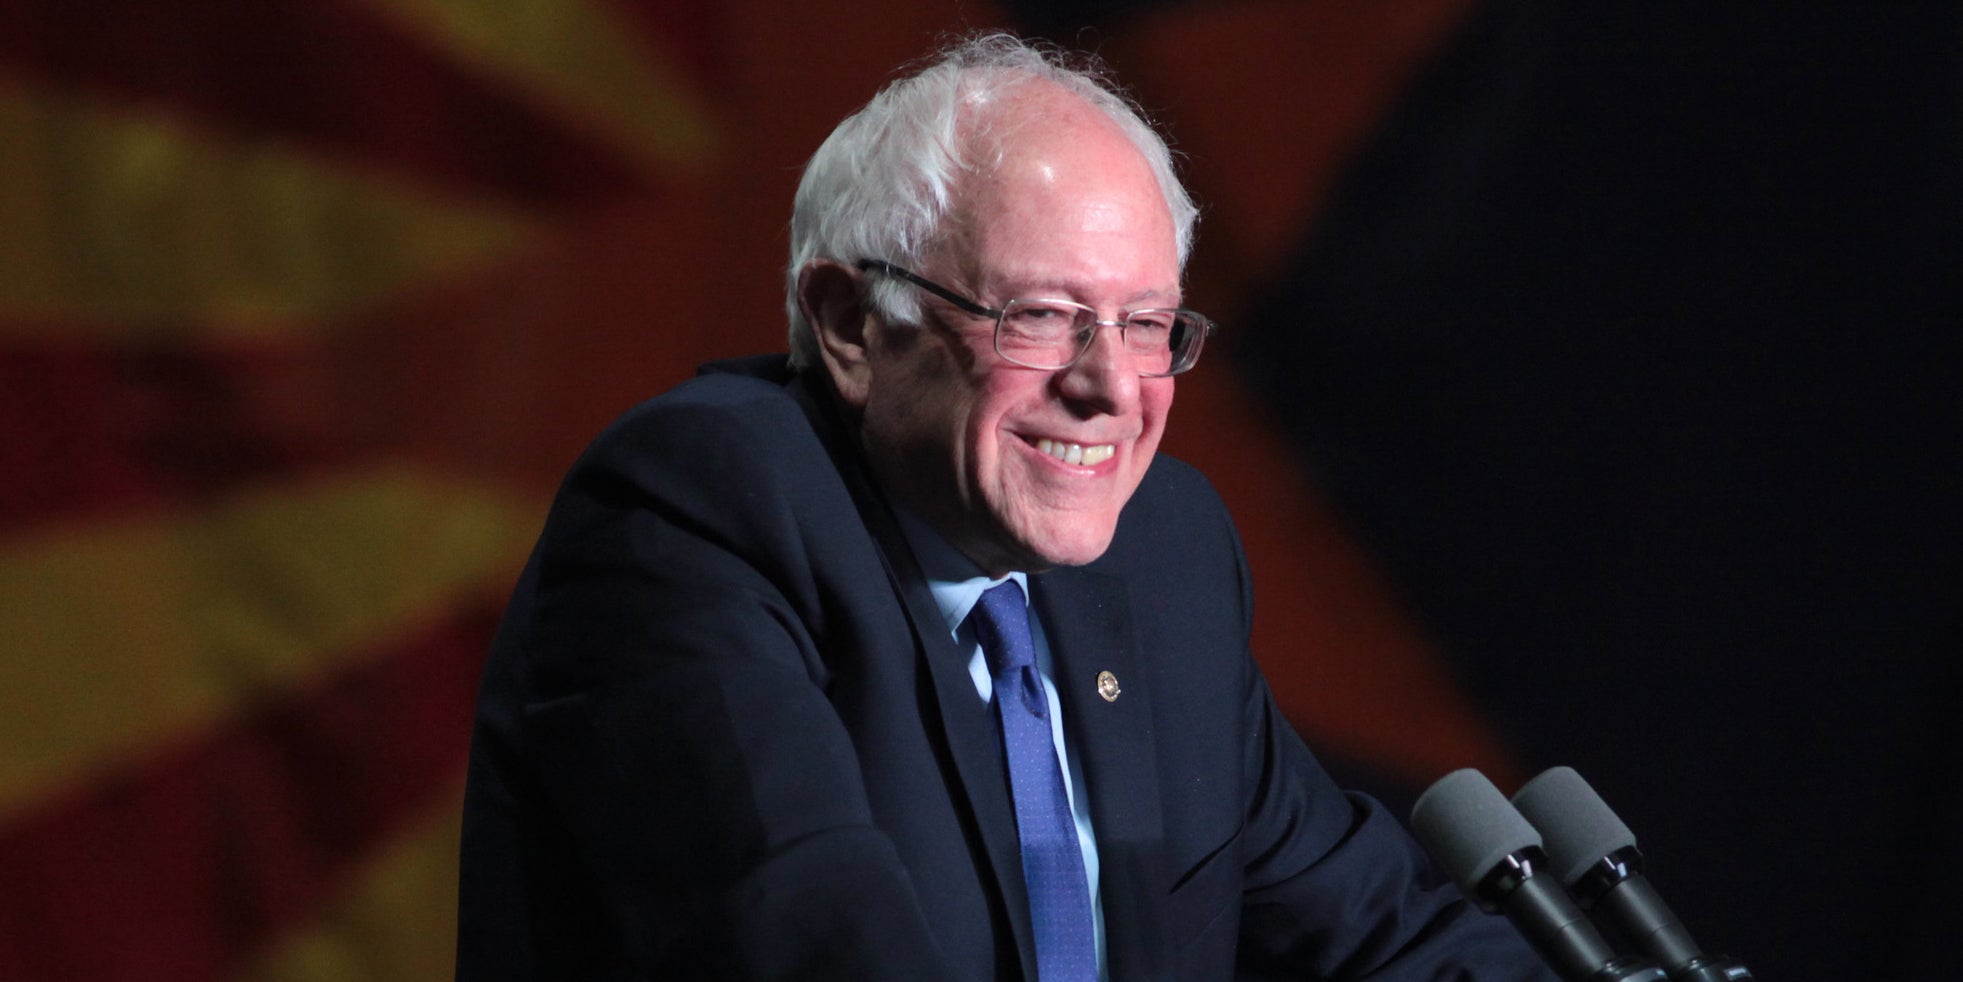
Total spent: $3.9 million
Number of ads: 31, 490
Impressions: 157.6 million
Avg. spend per ad: $123
Cost per impression: $.02
Sen. Kirsten Gillibrand (D-N.Y.)
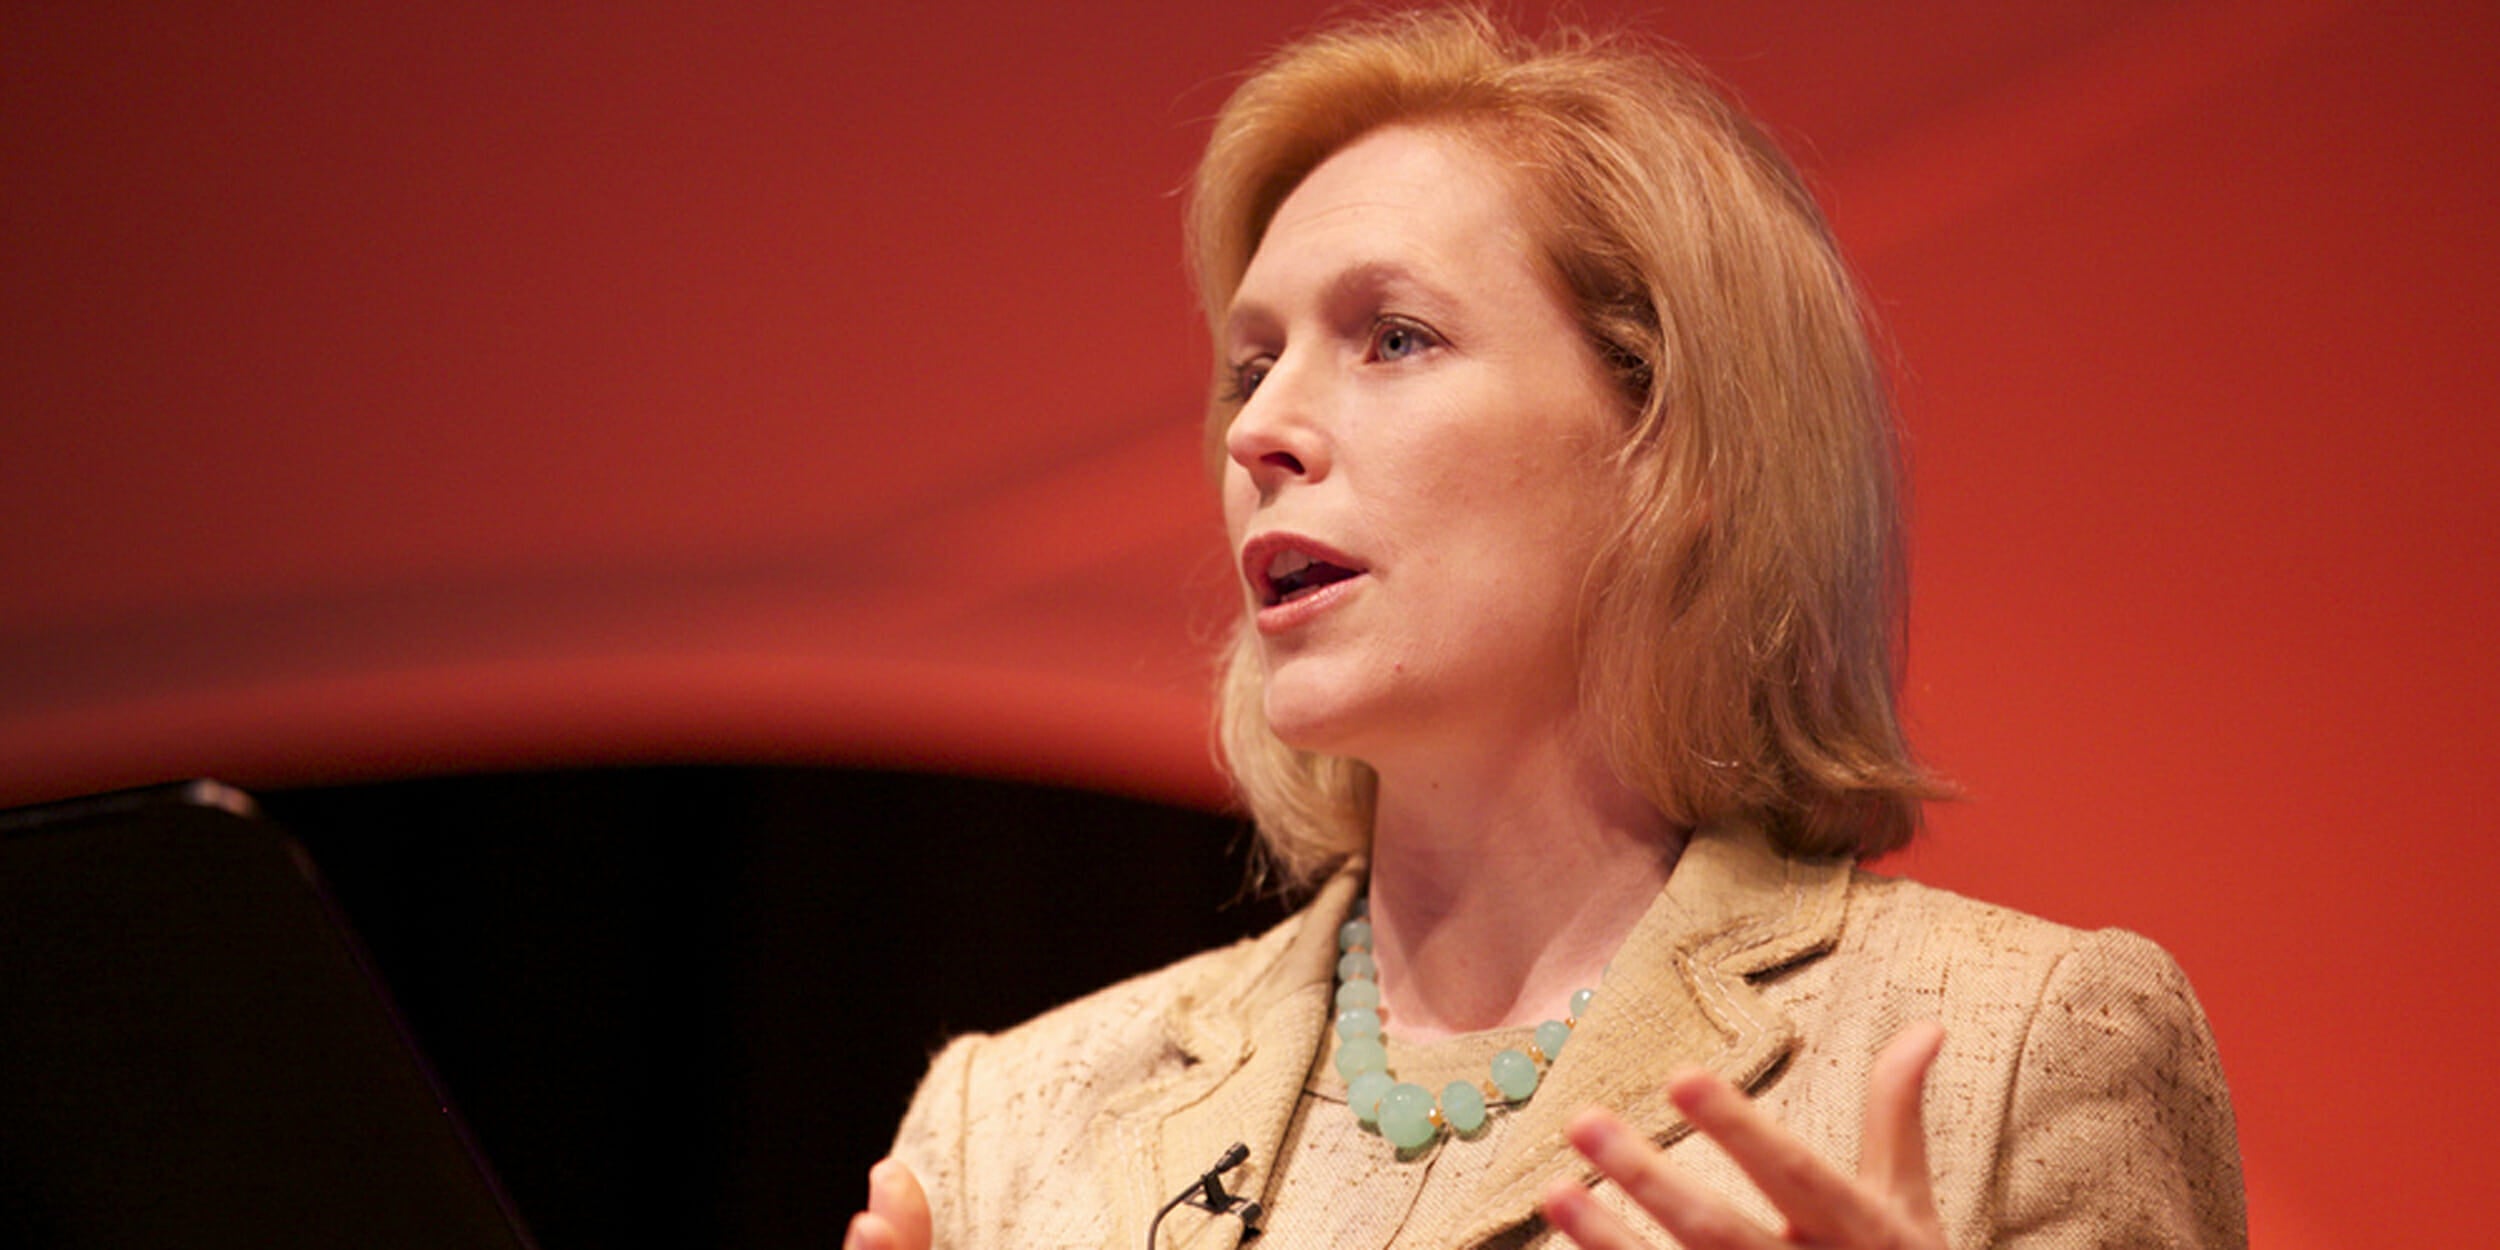
Total spent: $3.1 million
Number of ads: 9,742
Impressions: 78.8 million
Avg. spend per ad: $318
Cost per impression: $.04
Former Vice President Joe Biden
Total spent: $2.9 million
Number of ads: 4,921
Impressions: 77.9 million
Avg. spend per ad: $589
Cost per impression: $.04
Sen. Elizabeth Warren (D-Mass.)
Total spent: $2.8 million
Number of ads: 9,520
Impressions: 130.3 million
Avg. spend per ad: $294
Cost per impression: $.02
Sen. Amy Klobuchar (D-Minn.)
Total spent: $2.6 million
Number of ads: 3,037
Impressions: 58.5 million
Avg. spend per ad: $856
Cost per impression: $.04
Andrew Yang
Total spent: $1.7 million
Number of ads: 8,558
Impressions: 94 million
Avg. spend per ad: $199
Cost per impression: $.02
Rep. Tulsi Gabbard (D-Hawaii)
Total spent: $381,000
Number of ads: 789
Impressions: 15.9 million
Avg. spend per ad: $483
Cost per impression: $.42
New York City Mayor Bill de Blasio
Total spent: $91,000
Number of ads: 579
Impressions: 1.9 million
Avg. spend per ad: $157
Cost per impression: $.21
And since it wouldn’t be a true comparison without data from the other candidate, here you go:
Donald Trump
Total spent: $13.6 million
Number of ads: 99,407
Impressions: 489.6 million
Avg. spend per ad: $137
Cost per impression: $.03
The data provides some killer insights that in the past we’d just have to guess at. In spite of outspending everyone by a stiff margin, Harris’ 96.6 million impressions lag well behind the number that Sanders (156.7 million) and Warren (130.3 million) are putting on the board and she’s barely beating Yang (94 million).
This indicates that earned media and citizen interest are factoring into how many people Facebook shows these ads to.
Regarding cost, the top spenders—including Trump—average a few pennies per impression, while Gabbard ($.42/impression) and de Blasio ($.21/impression) are much higher, which also tells us that lesser-known candidates have to cough up more per person to spread their message.
And while Trump’s $13.6 million puts him well ahead of each Democratic candidate’s spending total, as a group they are trouncing him with a total spend of $20.5 million from Jan. 1 to Aug. 1. Similarly, their cumulative total impressions of 653 million place them well ahead of Trump’s 489.6 million.
So what does this all mean? First off, Facebook is rich and getting richer by the minute, absorbing political ad dollars like a dark star. Secondly, regardless of all the scandal and drama, politicians have not lost their taste for those targeted campaigns.
Which basically means that no matter who loses the 2020 presidential election, Facebook wins.
Correction: Alaska and Hawaii are included in ad.watch’s data.
READ MORE:
- Did the Krassenstein bros exploit the Haitian disaster to get more followers online?
- We’re more active on Facebook than 2018, 2017, report shows
- Report: Facebook’s political ad transparency tool is full of bugs
Got five minutes? We’d love to hear from you. Help shape our journalism and be entered to win an Amazon gift card by filling out our 2019 reader survey.
