In the era of Big Data and online advertising, when virtually every aspect of our lives is recorded, one key bit of data has been conspicuously absent: The number of Americans killed by police.
Until now.
After former Ferguson, Missouri, police officer Darren Wilson fatally shot 18-year-old Michael Brown in August 2014, government agencies, like the FBI, CDC and Bureau of Justice Statistics, received heat for failing to report comprehensible data on police killings nationwide.
According to a study, the Bureau of Justice Statistics undercounted the number of people killed by police by more than 50 percent. The Federal Bureau of Investigation hasn’t required state and local law enforcement to submit data on police killings, thought the agency recently said it plans to collect better data on police killings.
“It’s important for people to know black people are being killed by police at three times the rate of white people.”
Thanks to grassroots efforts, however, that is changing, shining the cold, hard light of data on one of the most hot-button issues facing America today.
There are crowdsourced databases—Fatal Encounters and Killed By Police—that have collected better data on police killings than the government. Samuel Sinyangwe, a data scientist and former policy analyst at PolicyLink, said no one had merged those databases or coded for race in a comprehensible way, something he and his fellow activists aimed to change.
Sinyangwe, Johnetta Elzie and DeRay Mckesson, launched Mapping Police Violence, a research collaborative project, in March, with the aim of collecting comprehensive data on police killings in the U.S.
The effort is seen as more comprehensive than other similar projects that emerged in the past year. And unlike other projects, like the Guardian’s The Counted or a similar data project from the Washington Post, Mapping Police Violence puts race at the center.
“It’s important for people to know black people are being killed by police at three times the rate of white people,” said Sinyangwe, who referred to some of the findings as “crazy.”
“We created the crisis last year to make it national conversation of ‘hey, the police are really out of hand. Not only are they super out of hand, but we’re dying,’” Elzie said.
According to Elzie, people were asking for the statistics on police killings. With the launch of Mapping Police Violence, the data shows how the populations of black people across cities in the U.S. are lower, but the rate of police killing black people is disproportionately higher.
“The data backs up the actual rallying cry black people been saying for—not only just 2014, August 9, but literally centuries that we’ve been here under the American government,” she said.
According to the findings of Mapping Police Violence, there are 17 cities where police kill black men at a rate higher than the U.S. murder rate. The lack of this data complicates the discussion now raging on police brutality in the U.S., Sinyangwe said.
Sinyangwe, Mckesson, and Elzie checked for accuracy and filled in the missing gaps from other databases, which included coding the data by race, armed and unarmed victims. To gather this data, they looked at obituaries, social and online images, arrest records, and local media reports.
“We didn’t know whether this issue was getting worse over time, whether this was a constant trend, or even if police killings were going down,” Sinyangwe said. “We didn’t know which places were doing a good job in reducing or mitigating police violence or doing a terrible job and needed to be changed. We didn’t know the racial disparities. We didn’t know the proportion of people killed by police that were unarmed.”
It’s a small team with volunteers. Sinyangwe acknowledged it’s a lot to handle. He focuses on the data collection and analysis, while Mckesson and Elzie help communities and protesters understand and use the data. Elzie said the numbers are new to her, but Sinyangwe helps her understand the data, giving her insights that she can then pass on to the community.
“Once he teaches it to me, I’ll go and I’ll tweet about it, or I talk about it on a panel or just be like, ‘well, this is a new way to think about that,’” said Elzie, who added that the data means she’s 100 percent backed up in discussing statistics on police killings.
“That’s how I learn a lot of things is, just by having different conversations with different people and then sharing it,” she added. “I guess the satisfaction in that is knowing that other people are learning as I go…”
Mapping Police Violence noticed trends: constant police violence over the last three years; police killings rising over the summers; and that the only significant drop in police killings nationwide happened in September 2014, the month after Brown’s death, by more than 50 percent.
They aren’t alone. The Guardian started recording data this year using similar resources. Jamiles Lartey, a writer and researcher at “The Counted,” confirmed the project received some criticisms for its race-focused homepage.
Originally the page centered around the number of police killings by race, a rate that looked higher for white people until The Guardian addressed the proportions of population. The number of African-Americans killed by police in 2015 so far has been disproportionately high compared to white and Hispanic Americans.
“We didn’t know whether this issue was getting worse over time, whether this was a constant trend, or even if police killings were going down.”
Lartey clarified the point is to track police killings, not only the killings of black people. “The only agenda is tied into the fact that as everyone knows there’s national conversation about policing, and race is very big part of that conversation,” Lartey said. “We’re sensitive to that.”
Mapping Police Violence is updated almost on a weekly basis, but the protesters aren’t only focused on this one platform. Back in August, the group launched Campaign Zero, a platform highlighting policy solutions for reducing police violence from activists and research organizations.
“Mapping Police Violence will continue to be focused on the data,” said Mckesson, one of the most popular civil-rights activist of the Black Lives Matter movement. “And Campaign Zero, we’ve gotten a lot of feedback, and we continue to get feedback about it, which is helpful and the platform will grow.”
Mckesson’s group, We The Protesters, met with Bernie Sanders to discuss Campaign Zero, police violence and other issues related to systemic racism on Wednesday, Sept. 16.
Mckesson and Hillary Clinton’s campaign exchanged tweets almost a week later that landed him a meeting with the Democratic Party’s frontrunner about discussing her upcoming race and criminal-justice platform.
As the protesters are meeting with Democratic presidential candidates to discuss solutions to police violence and systemic racism, Mckesson said that he and We The Protesters aren’t done creating solution platforms.
“I anticipate that we will [build] another platform that addresses different parts of state violence—like beyond policing,” Mckesson said.
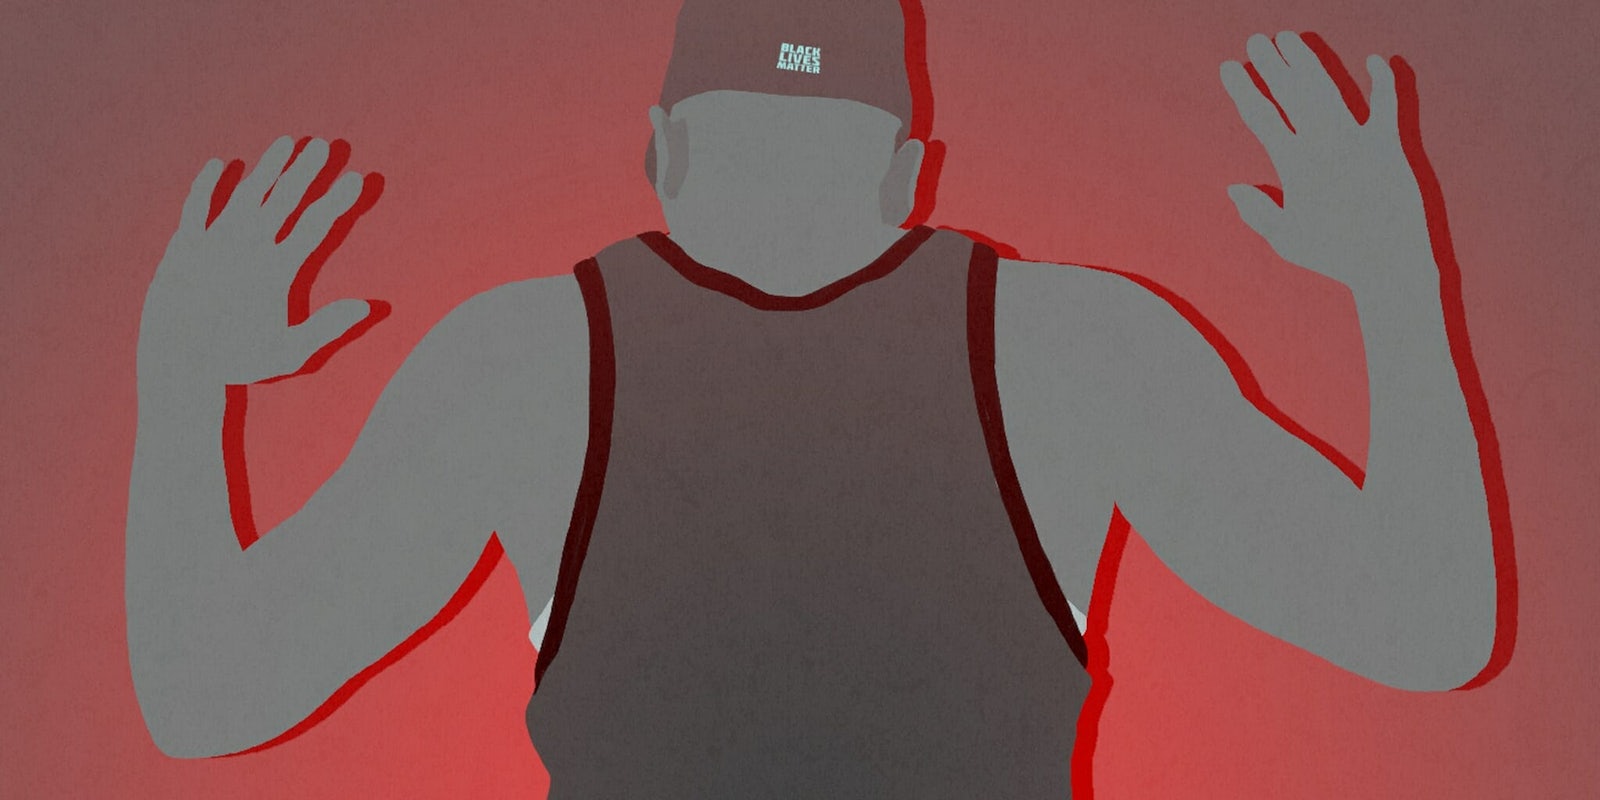
Illustration by Max Fleishman.
A previous version of this story stated Sinyangwe still works with PolicyLink. He’s now with We The Protestors full time.

