
You know you shouldn’t believe everything you read on the Internet. Well, that’s doubly true when it comes to scientific stories and studies.
As the recent faked chocolate diet study illustrated, science information online is often inaccurate and incomplete. To recap: A science journalist cooked up a fake name and did a clinical trial in Germany wherein he stacked the deck to make sure his results would suggest that eating dark chocolate can aid in weight loss. Then he alerted the press, which obligingly circulated the enticing headline without questioning the study or the scientists, duping potentially millions of readers.
Criticisms of his ruse—and there are many—aside, the fact that so many journalists just regurgitated some crap data is disconcerting. With so much information out there and a decent amount of bad science too, how can an informed reader make sure that they’re getting the best and most accurate science info?
First, you have to understand how science works, learn how to read a scientific article (and a journalist’s article about science), know where to find reputable information, and know what to look out for. It involves a little homework, but it’s well worth it.
How science works
First and foremost: Science is slow. For every study that publishes a major breakthrough, there were countless before it that established or refuted small bits of information that led to the big reveal. Science moves at an incremental pace, where researchers bicker with each other and tinker with data until they generally come to a consensus. Unfortunately, if science journalists only reported on those big breakthroughs, we’d starve from lack of work.
Scientific research also doesn’t always agree with itself. Sometimes two very similar experiments can lead to very different results, and scientists aren’t sure why. This is especially true in human studies, which are constrained by ethics that dictate that you can’t just do whatever you want to people.
The Language of Science
There’s also an invisible language barrier between scientists and laypeople, which sometimes presents itself as a problem. Take the vaccines and autism controversy, for instance. There are no connections between vaccines and autism. But you can’t prove a negative, as Seth Mnookin, co-director of MIT’s science journalism graduate program and author of The Panic Virus, said in an interview with The New York Times. So researchers use “signifiers” or phrases like “to the best of our knowledge,” or “as far as we know,” when talking about the lack of connection between vaccines and autism.
“When scientists speak in their language, and the rest of us translate that into English, it sounds like they’re saying something very different,” Mnookin said. Journalists, who were either fishing for a good story or simply unaware of this language barrier, took those signifiers to mean that scientists couldn’t say with certainty that vaccines do not cause autism. They treated it with the same level of skepticism you might give a city councilman who tells you there was no wrongdoing in his office “to the best of his knowledge.” Sounds fishy, right?
Significance is another big word that means different things. In plain English, significance means something is big enough to create a meaningful impact. But in statistics, significance means that an observed pattern in data is probably not random. So if a researcher says her results are significant, she is likely referring to the outcome of this statistical test. If you have the right sort of data, even a small pattern in the data can look significant—even if it’s not in the nonscientific sense of the word.
Levels of data
Not all studies are equal, and some data are better than others. Researchers have various tools to study natural phenomena, but some of those tools can prove more powerful than others.
Look out for observational studies—these are usually done on people or animals where researchers merely look for patterns in data that they did not obtain themselves. Observational studies are “uncontrolled.” That means that variables—elements that can affect the outcome of a study—are not accounted for. Observational studies usually lead to correlational results. In other words, Y increases as X increases or decreases. But correlational data are often flawed and don’t show a true relationship. For example, shark attacks rise and fall with ice cream sales. Obviously ice cream sales don’t cause shark attacks—both are likely to rise in the summer with more people going to the beach and buying ice cream. But in real-world science, people—including journalists—often miss this important point. Phrases like “X was associated with an increase in Y” denote correlation.
The best studies are usually controlled, with one group of subjects receiving some kind of “treatment” and the other receiving nothing or a placebo. It’s even better if it is done under “double blind” conditions so that during the experiment neither the subjects nor the experimenters know who’s getting what.
Those studies are hard to carry out, though, because sometimes control groups or useful placebos are not possible given the experimental constraints.
Read the study, if possible
When reading an article about science, it can be hard to know if the journalist knows all the pitfalls of science coverage or not. If you can, track down the original study. This may be as easy as clicking a link in the article, or you may have to do some searching.
PubMed, Google Scholar, and ScienceDirect are all great databases to find articles. Searching by the author’s name and some keywords from the study usually works best. Not all articles are open-access, and there are reasons for that. But you can usually get some meaningful information from the abstract summary you can read before hitting the paywall.
You may be wondering why you have to do all this homework. You don’t, of course. You can take science news at face value, but remember that you’re reading an interpretation of an interpretation of an interpretation of raw data. In other words: Researchers get the data, they interpret it using math and statistics, then they interpret it again using words. Then a journalist interprets the data by reading the words written by the scientist (hopefully) and delivers his understanding to readers. While we science writers do our best to give you the clearest call quality in this game of telephone, you might as well check out the data and decide for yourself. In doing so, you may uncover something the reporter missed.
But reading science studies can be exceptionally tedious and confusing if you don’t know how to do it. Even students in university programs are taught how to read scientific articles. (I learned in the science communication graduate program at the University of California Santa Cruz.) They come in a standard format, though the order of sections change between journals. All science articles begin with an abstract and an introduction. Then there’s usually methods, followed by results, then a discussion of the results.
Most of the time, unless you have university and/or media access to journals, you will only be able to see the abstract. But some researchers and journals opt to publish open-access. (For example, the journal PLOS One, is entirely open-access.)
Here’s how I was taught to read an article:
Read the abstract first, it will outline everything you’ll see in the article. Understand the abstract, and note what data and results the scientists present there. Those are the results that they want you to see (though they may not be the most important). The abstract won’t usually discuss the limitations of the study, details of the methods, or show you their less sexy/interesting results. But those un-sexy, un-interesting results usually demonstrate the limits of the experiments and possibly information that may contradict or lend an air of skepticism to the results. So take abstracts with a grain of salt.
Then read the introduction, that will give you context and set up the hypotheses the researchers are going to test. If you’re really looking to dig into this area of research, check out the papers that the researchers reference because those are usually great review articles and key research articles that laid the groundwork for what is known/not known about the field.
Then skip the results and methods section to read the first couple paragraphs of the discussion. Methods and results are where you’ll run into the most jargon and heavy-duty math. But the discussion usually has a relatively plain-language summary of the methods and results, so check that out first. Then, if you’re so inclined, slog your way through the results before reading the methods. Then read the discussion in its entirety, and keep your eyes out for where they discuss the limitations of the study, if they do. That will clue you into how their methods were imperfect (they almost always are, because it’s difficult to control for all variables) and alternative ways to interpret their results. Lastly, keep an eye out for any declarations of conflicts of interest, sources of funding, or other potential factors that may influence the researchers. They’re not always printed in the article, but they should be.
If there isn’t a limitations section, you probably want to at least skim the methods and results sections to look for errors in their data or ways that their results can be interpreted differently.
How to spot bad science
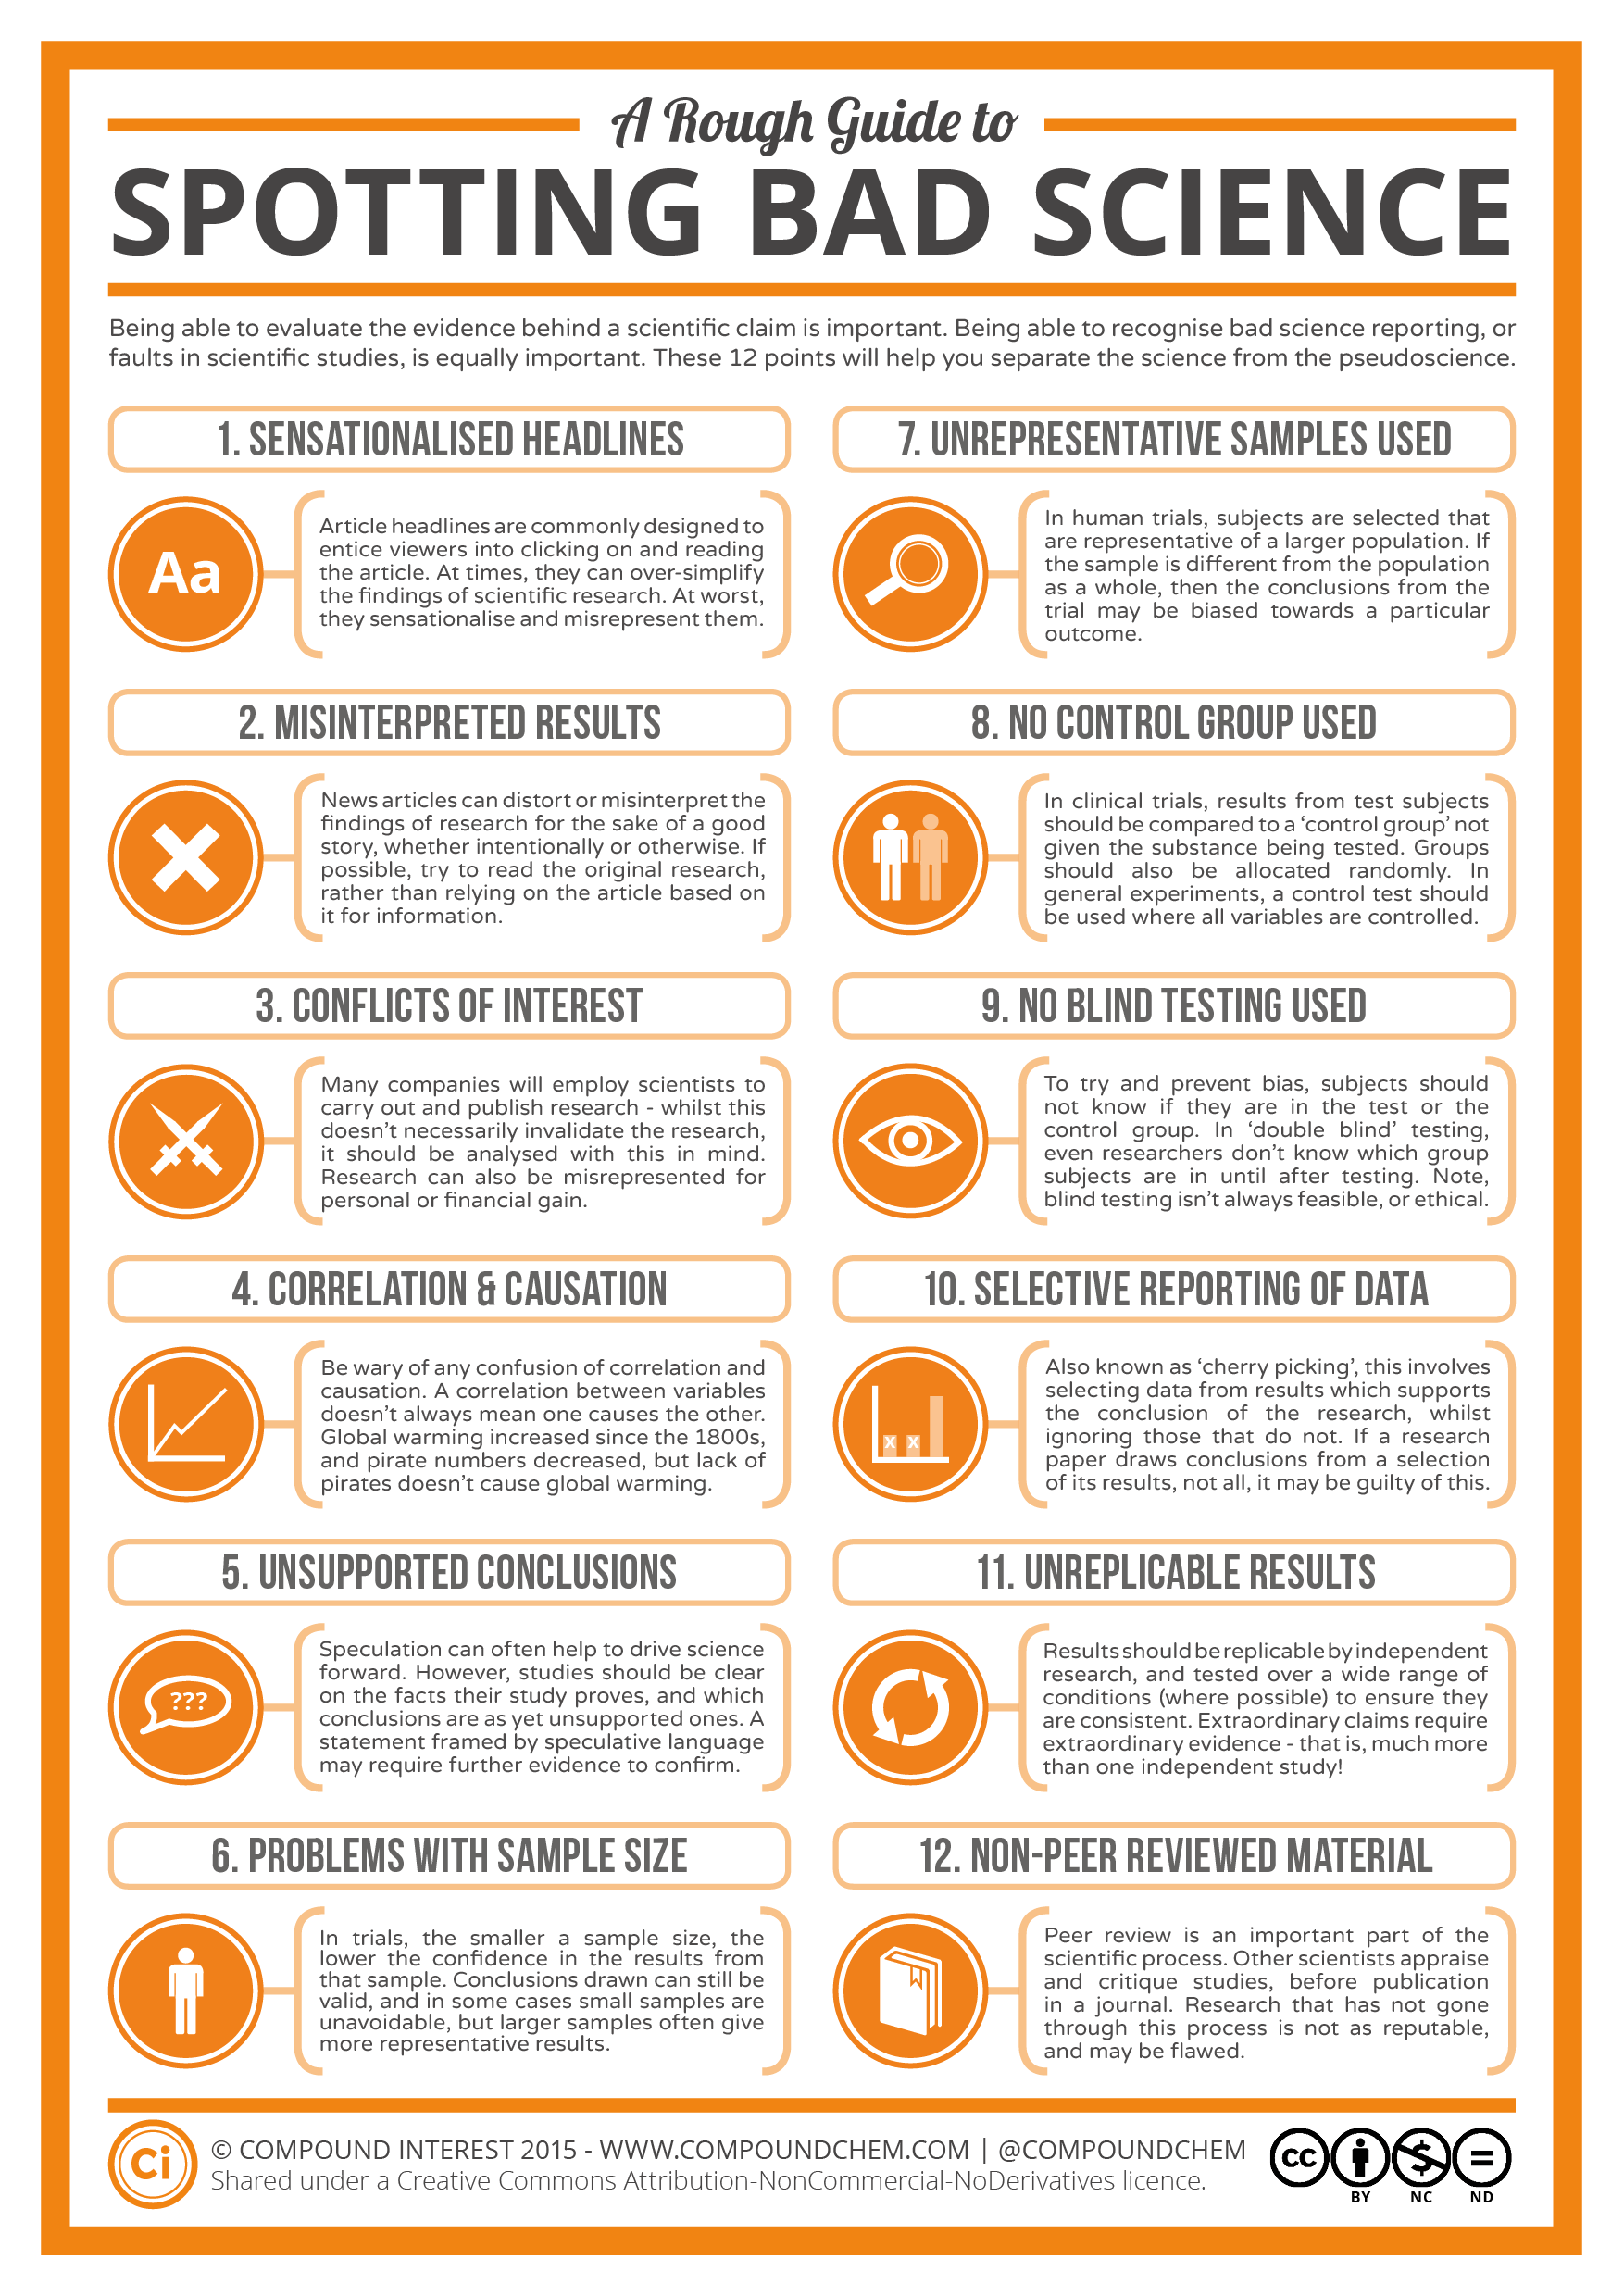
When you’re reading any article, be it from a research journal or in a general interest newspaper or website, you should keep an eye out for bad science. This infographic from Compound Chemistry is helpful. Study it, memorize it.
Perhaps the most pertinent and easy-to-spot items are low sample sizes, no control group or blinding, and the correlation/causation fallacy, which we’ve already discussed. The infographic also mentions speculation (on the part of the researchers). But look out for speculation on the part of the journalists, too. Some will present it as fact or as a reasonable implication of the research. But speculation is always just that, and you should take it with a grain of salt.
Always be skeptical
Honestly, you should always read studies and reports on studies with a degree of skepticism. That’s just the smart thing to do. When it comes to reading about science online, in a newspaper, or a magazine, ask yourself who the target audience is. Is it you? Do you find the information in the article to be aligned with your political/social beliefs? That may be by design. With the constant war for eyes and attention on the Internet, news outlets increasingly cater to niche audiences. See if the same study was covered in other news outlets and see how they report it. They may touch on an aspect of the study that another outlet didn’t cover.
An article that talks to researchers who didn’t conduct the study but who are experts in the field and that reports on numerical results and aspects of the methods will always be better than one that essentially just says “X does Y because science.”
The best science coverage can usually be found at sites that specialize in science and technology coverage, or mainstream news outlets that have dedicated science sections and science reporters. Such mainstream sites include the New York Times and NPR, but unfortunately science coverage is generally waning in the mainstream media (probably contributing to all the bad science headlines out there). You really do need specialists for this stuff.
Last, be aware that some articles, in an attempt to be the objective “view from nowhere” or to create a more clickable story, will present controversy often where there is none.
Let’s be clear: 97% of scientists agree that climate change is real and that humans have a hand in it, there is no connection between vaccines and autism (the study that suggested there was has been found to be fabricated and was retracted from the journal in 2010), and evolution definitely happens.
Now go forth and consume science!
Screengrab via Robert Couse-Baker/Flickr (CC BY 2.0) | Michael/Flickr (CC BY SA 2.0) | U.S. Army RDECOM/Flickr (PD) | Remix by Jason Reed