Tumblr, with its rowdy emphasis on fandom, memes, and GIF-culture, might seem an unlikely place for meaningful education to take place, especially in the field of mathematics. But surprisingly, a new Tumblr created to showcase one Wikipedia user’s graphic enhancements for that website may be spreading the love of sine language—and cosines, waves, and functions—to the masses.
LucasVB has a Wikipedia gallery full of marvels, from 3-D animations to the Wiki redirect arrow. Now he’s taken a few of his marvels over to Tumblr, with results both entertaining and educational. Lucas, a 27-year-old Brazilian, started his Tumblr just over a week ago, but already he’s been busy sharing graphics—one of which has racked up over 80,000 notes since Feb. 11:
In this graph, Lucas is illustrating the familiar sine wave as derived from a circle, and the less familiar look of the same wave when derived from a square and a polygon. The result is an elegant illustration of the practical applications of mathematics. In a follow-up post, he renders these same trigonomic functions as sound waves, with the option to alter both frequency and function:
Graphic via 1ucasvb/Tumblr
In an additional post, he extends the illustration by rotating the polygons:
Lucas tells the Daily Dot that he joined Tumblr because of Reddit. “Someone asked me on [R]eddit if there was any way they could know about new animations I created for Wikipedia. I figured making a tumblr blog would be a good place, since it’s more focused on media, especially GIFs.”
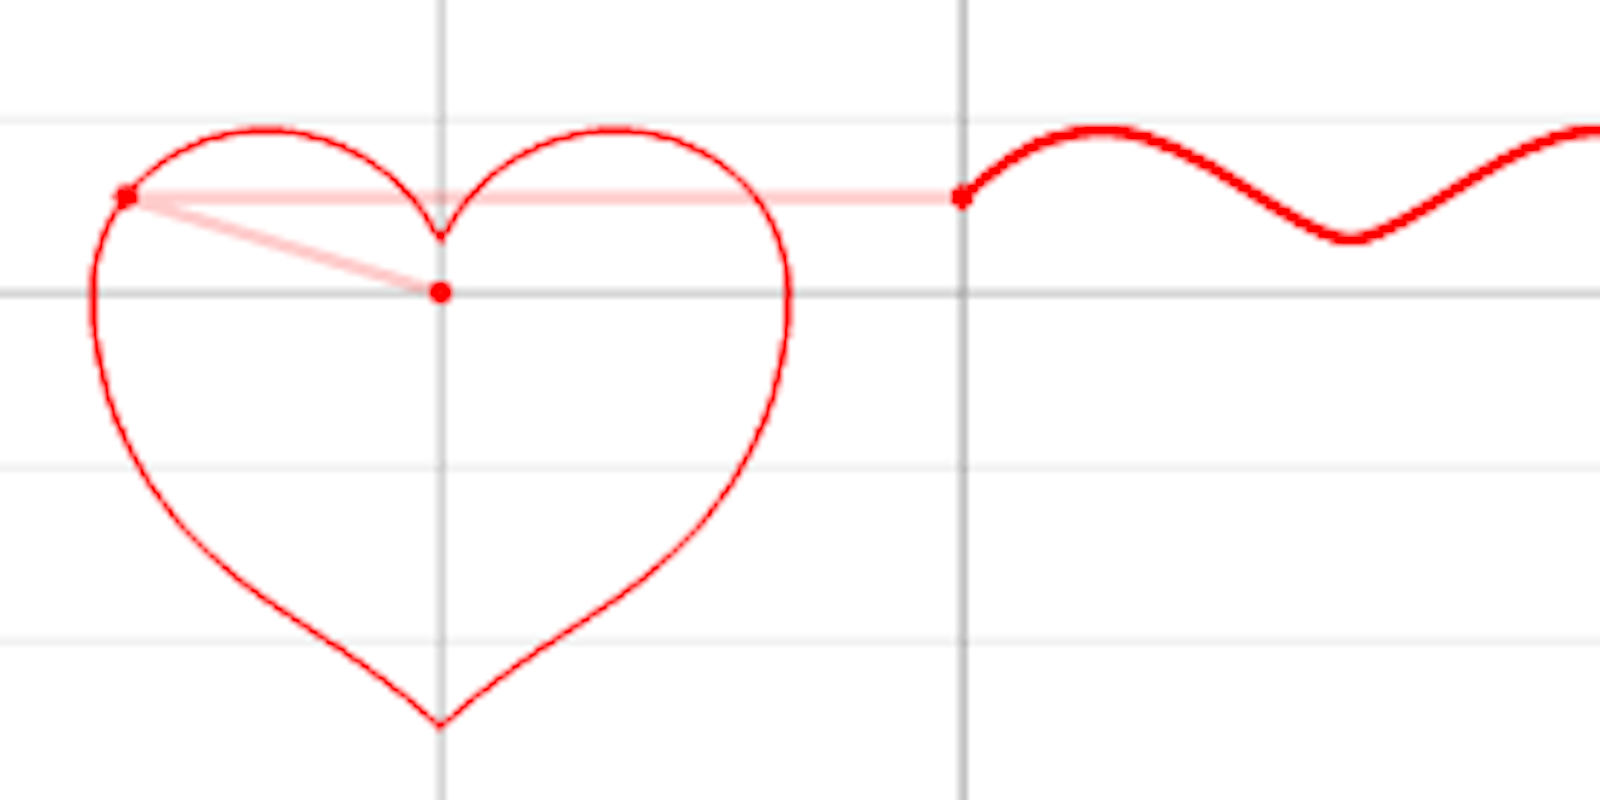
Lucas is not the first person to bestow a wealth of math in the form of graphs upon Tumblr. In addition to the perennial favorite, but significantly more wide-ranging, ilovecharts, Cambridge maths scholar Matthew Henderson is also using Tumblr for his Math graphics. In one image, he shows his readers how a something called a cardioid can be constructed from a simple circle–showing us the range of directional microphones in the process. In another, he shows us how to translate spoken language into visual data based on sound frequencies.
Henderson’s work in sine-wave animation inspired Lucas to make his own “toy” based on the Fourier Series, a group of partial differential trigonometric equations that have proved useful for everything from electronics to quantum mechanics.
Graphic via 1ucasvb/Tumblr
Click the space bar to start the sequence, type in different numbers to change the variant frequencies, and right-click over the image to see different patterns in action.
While Lucas’ polygonal graphic has gone viral, it’s hard to see whether the discussion around the mathematics of his work has expanded as well, or whether people are just content to look at the pretty GIF. But Lucas tells the Dot he isn’t worried about what people derive from his Tumblr work.
“I just love being able to show people how cool mathematics and physics really are. These are immensely important and beautiful areas of knowledge that usually get a bad reputation of being dry, dull and complicated. I’m doing what I can to fix that… I think this sort of animated illustration should be mandatory in every math class. Hopefully, they will be some day.”
In other words, as Tumblr user dekutree so eloquently put it:
this looks mathematical as fuck man shit look them radiuses times pie sending out waves this is how they build homes, this is how they make space ships and how they cure diseases im feelin all kinds of smart lookin at this shit
On Tumblr, this is as good a sign as any that real education has taken place.
Image via 1ucasvb/Tumblr