As I write this, someone in Cincinnati just modified the Wikipedia entry of the 2002 film “Unfaithful.” Someone else in Spruce Pine, N.C., just update the article on jazz trumpeter Dizzy Gillespie.
I know this not because I obsessively scrutinize these two articles every morning for changes. No, I know about these changes because I’ve been obsessively scrutinizing this map.
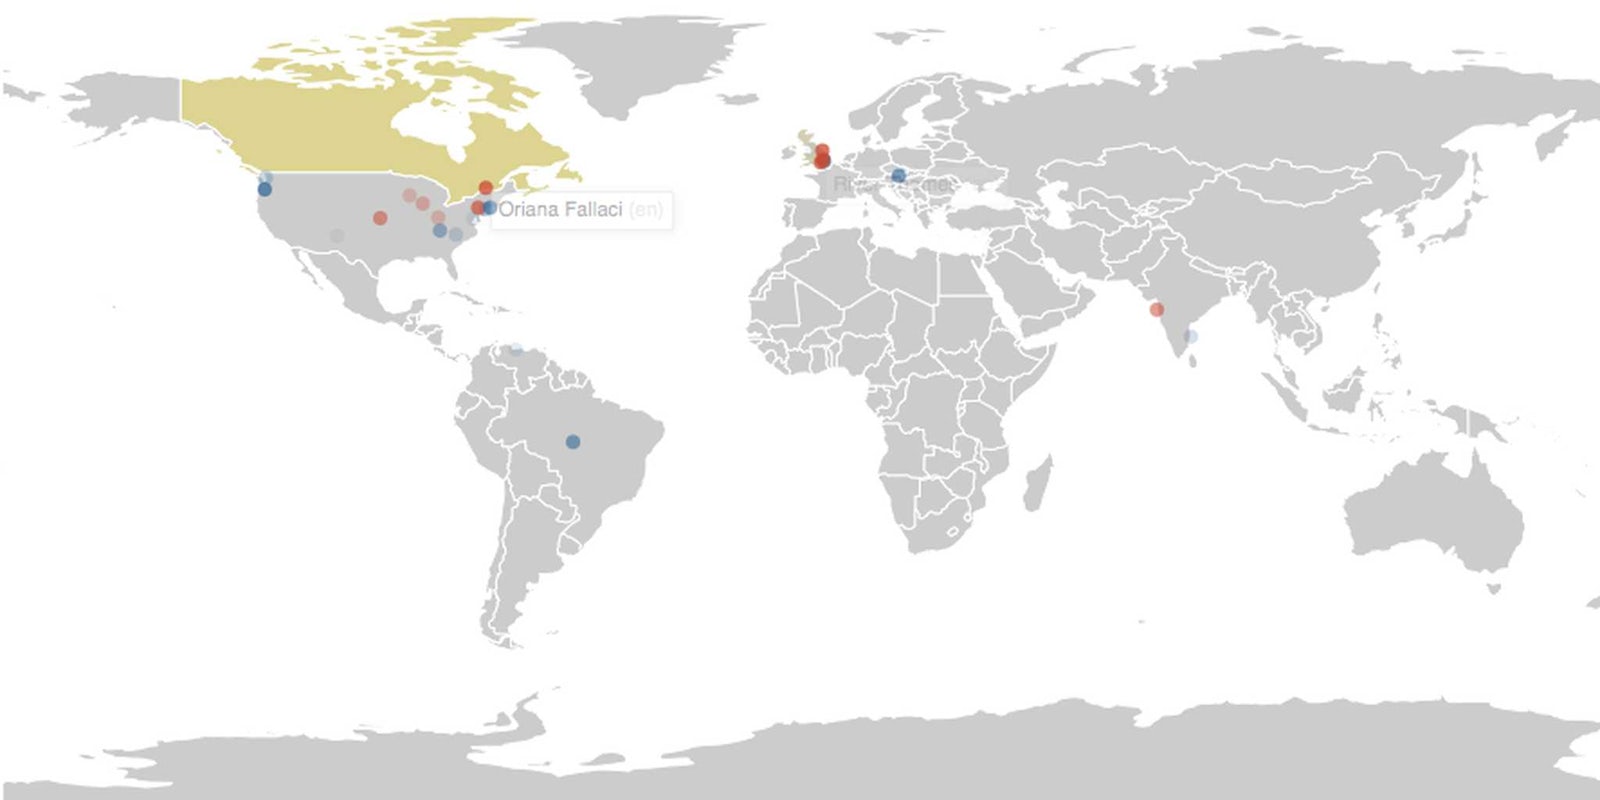
It’s the Wikipedia Recent Change Map, the latest in a line of web tools that help put the world’s largest online encyclopedia into a macro perspective. It’s one of many new apps and sites that have come along recently to monitor Wikipedia traffic and convert it into usable data.
It’s the creation of Stephen LaPorte and Mahmoud Hashemi. It launched on May 1 with a relatively simple purpose: Allowing people to see in real time where Wikipedia edits are coming from.
“This map listens to live feeds of Wikipedia revisions, broadcast using wikimon,” LaPorte and Hashemi write on their blog. “We built the map using a few nice libraries and services, including d3, DataMaps, and freegeoip.net. This project was inspired by WikipediaVision’s (almost) real-time edit visualization.”
The map was designed clearly out of a passion for data visualization, and indeed it is hypnotic to watch. If you’re a wee bit on the nerdy side, you can’t help but stare at the dots lighting up one after another across the globe. Then you look down at the corresponding text and wonder why someone in New York felt compelled to edit the entry for “The China Syndrome” at the same time someone in Staunton, VA had to edit the article about Bon Jovi’s “Livin’ On A Prayer.”
It’s not perfect though. Because of how Wikipedia registration works, the map can only track changes made by unregistered users—who account for only 15 to 20 percent of total Wikipedia edits.
But LaPorte and Hashemi’s map is just the latest attempt to harness Wikipedia traffic into usable data. Earlier this year, engineers from Google launched Wikipedia Live Monitor, an app that reports breaking news based on spikes in Wikipedia edits to a particular topic. The app is being promoted as a potential rival for Twitter in terms of being able to accurately report breaking news in real time using crowdsourced information.
“The main motivation of using Wikipedia instead of social media is you get a lot of events in one place—almost everything relevant in a breaking news sense has a Wikipedia page,” said Tom Steiner, who developed the live monitor app with two other researchers.
Image via Wikipedia Recent Change Map